
Some graphs showing the FS2 flight.
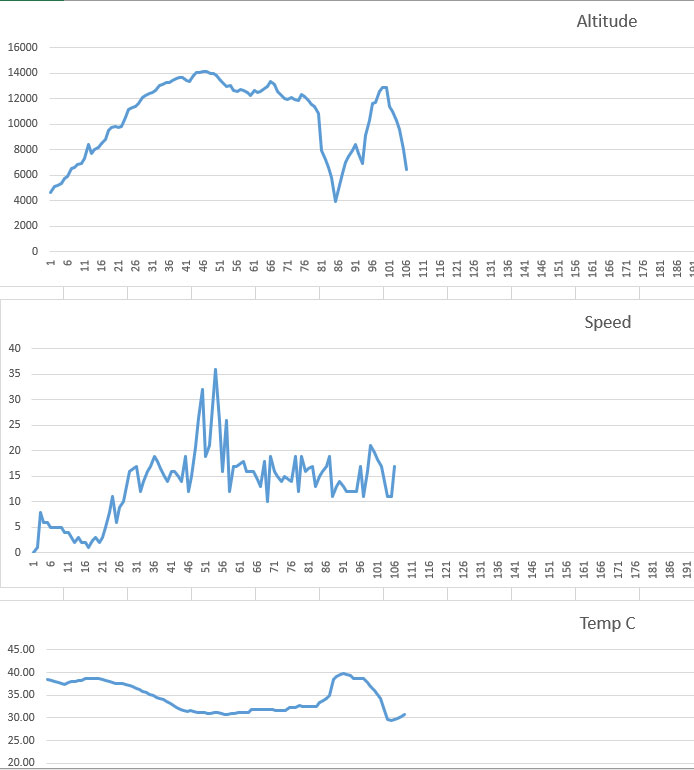
Gary W. produced a few graphs from the FS2 telemetry data that he received from the APRS.fi web site. The altitude (in feet) shows the deep, near death, dive bottoming out around the 86th data point. You can also clearly see the temp change upward at the same time period. Lower is warmer.
The ground squirrel team watched this dive thinking it was to be the end of our Brave Squirrel Pilot, but he pulled up in the nick of time. The team was also surprised with the miraculous recovery proving the balloons still had lift. FS2 was probably caught up in a down draft or the balloon may have cooled and contracted in the shade of a cloud loosing lift. The steep dive at the end of the graph was the end of the FS2.
More detailed data and analysis will be posted in the next day or two as the data is further studied. I plan to make a Google Earth KML file that will show the flight in 3D soon.
Thanks Gary!!
de Don KJ6FO